How to Use PerseuCPP
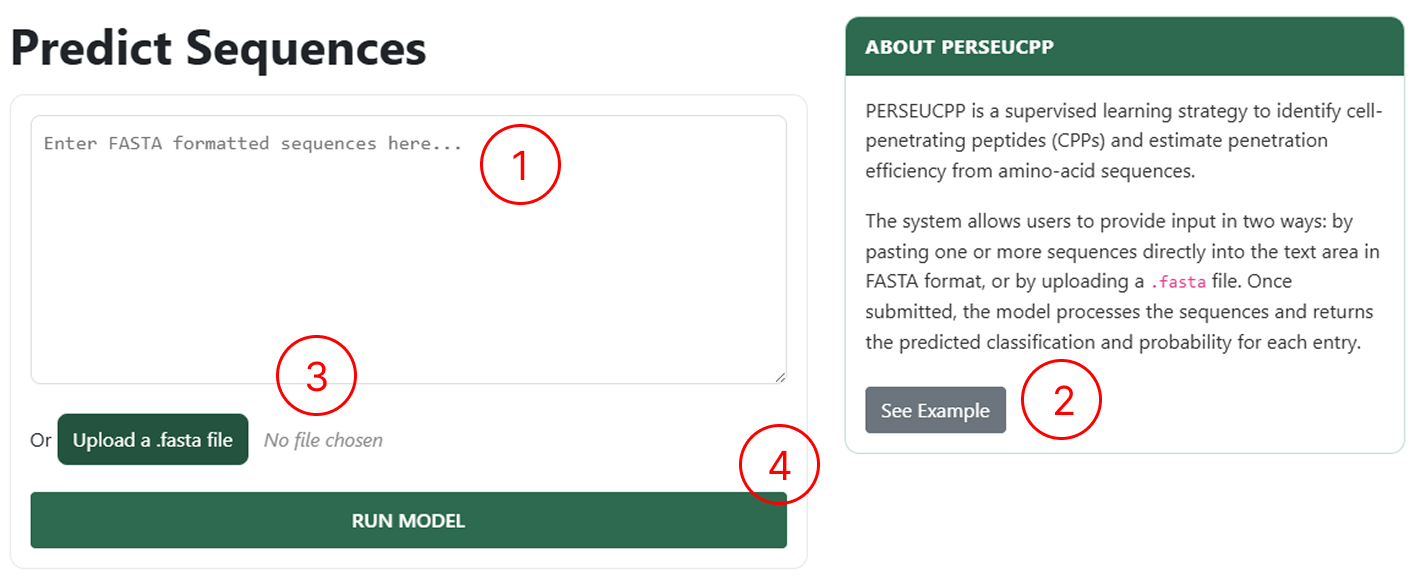
CPP Prediction Page
Use the CPP Prediction page to upload your peptides:
- Use this field to manually enter sequences following the FASTA format.
- If you want to see an example of how to manually insert sequences, click See Example.
- Use this field to upload a single FASTA file.
- By clicking RUN MODEL, you will be redirected to the results page.
Peptide Mapping Page
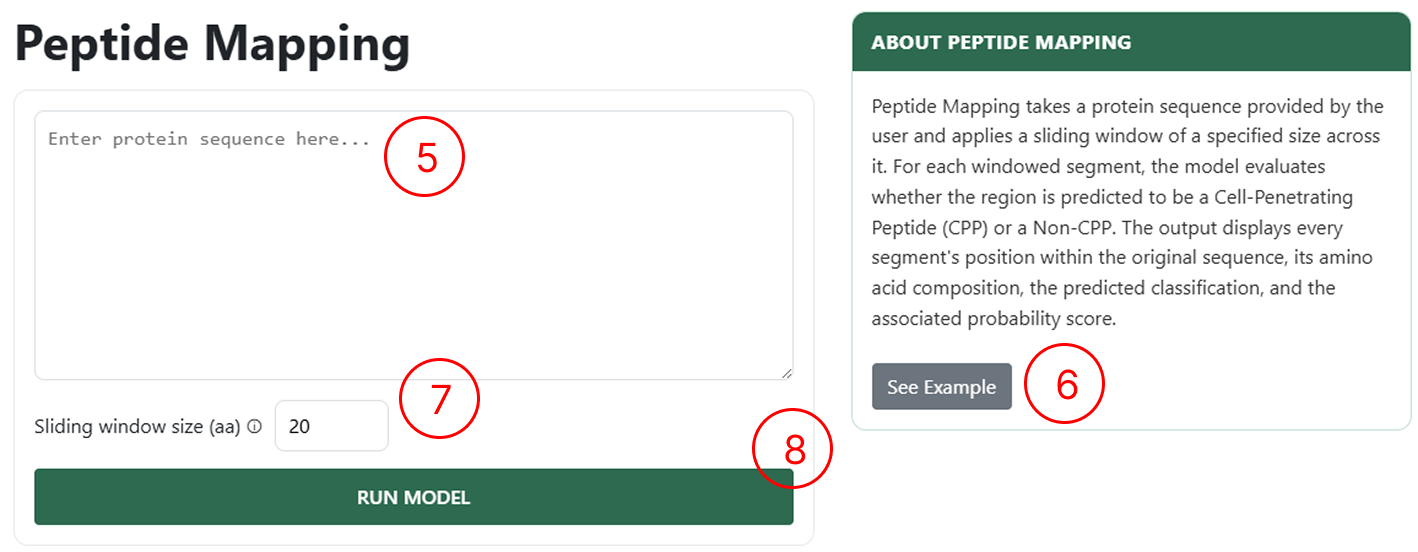
Use the Peptide Mapping page to upload your proteins:
- Use this field to manually enter sequences following the FASTA format.
- If you want to see an example of how to manually insert sequences, click See Example.
- Use this field to define the sliding-window size over the protein. For example, with a window size of 20 aa, the protein will be split into peptides of length 20 by sliding the window forward by one amino acid at a time.
- By clicking RUN MODEL, you will be redirected to the results page.
Understanding the Results
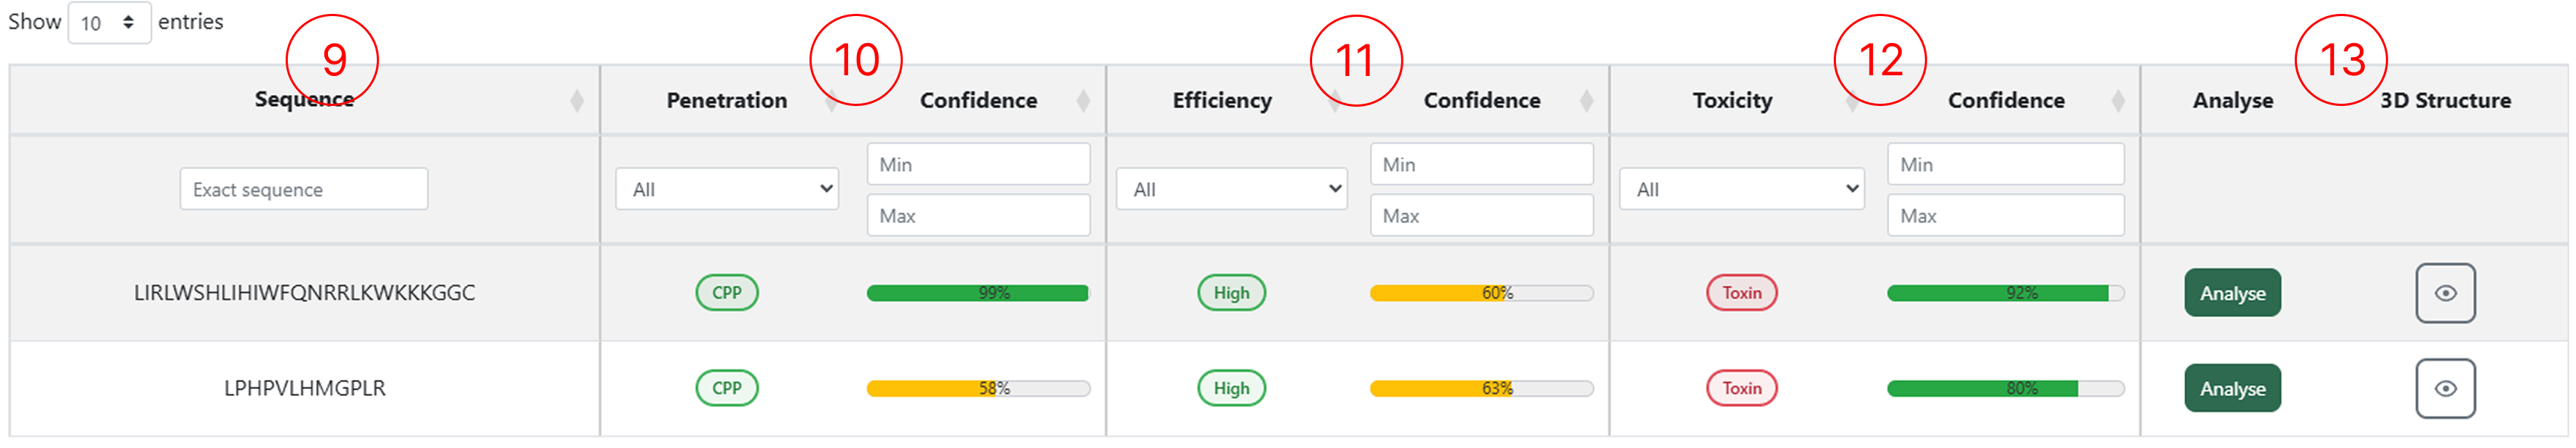
Results table (CPP Prediction)
The results table generated by the CPP Prediction module allows users to access multiple classification outputs for each submitted sequence. Through this table, users can inspect the predicted penetration class, efficiency and toxicity, as well as interact with the available functionalities by clicking the corresponding action buttons.
- The sequences entered in the CPP Prediction page appear in the first column.
- The peptide classification (CPP or Non-CPP) and its confidence score.
- The penetration efficiency classification for peptides predicted as CPP, along with the confidence score.
- The toxicity classification (Toxic or Non-toxic) and its confidence score.
- Buttons to access the Peptide Design feature and generate the 3D structure for the selected sequence.
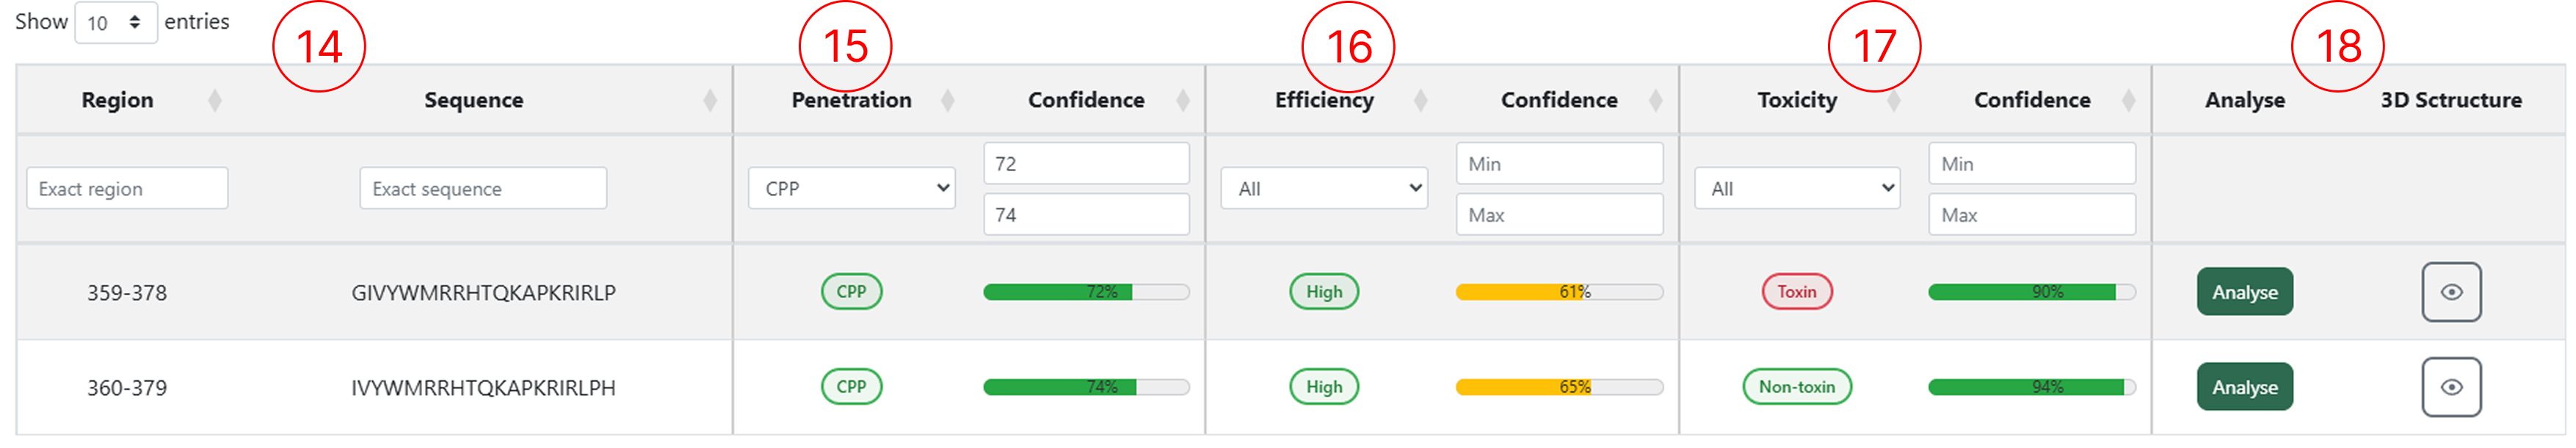
Results table (Peptide Mapping)
The results table generated by the Peptide Mapping module allows users to access multiple classification outputs for each submitted sequence. Through this table, users can inspect the predicted penetration class, efficiency and toxicity, as well as interact with the available functionalities by clicking the corresponding action buttons.
- The Region and the peptide sequence extracted from the protein submitted in the Peptide Mapping page, based on the sliding-window size defined by the user.
- The peptide classification (CPP or Non-CPP) and its confidence score.
- The penetration efficiency classification for peptides predicted as CPP, along with the confidence score.
- The toxicity classification (Toxic or Non-toxic) and its confidence score.
- Buttons to access the Peptide Design feature and generate the 3D structure for the selected sequence.
Interactive Peptide Design
Launching the interactive analysis
- By clicking Analyse on the desired sequence (as shown in items 13 and 18), the user is redirected to the Interactive Peptide Design page, where
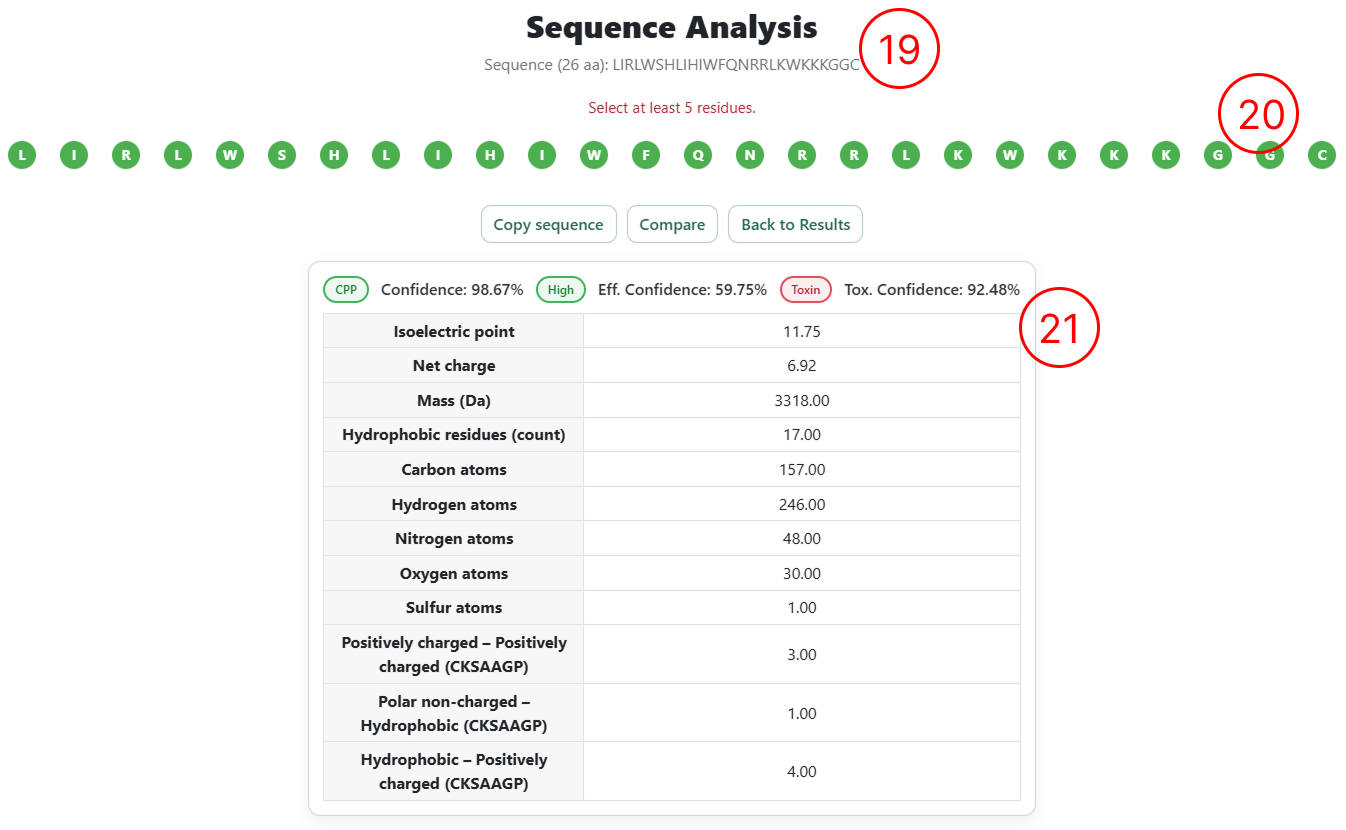
- The sequence is rendered with each amino acid as an individual editable element, allowing users to insert, remove, or substitute residues through direct interaction with the sequence.
- A summary table displays the predictions from the three predictive models (cell penetration, penetration efficiency, and toxicity), including confidence scores and the top 12 most relevant physicochemical descriptors associated with the classification.
Editing the sequence
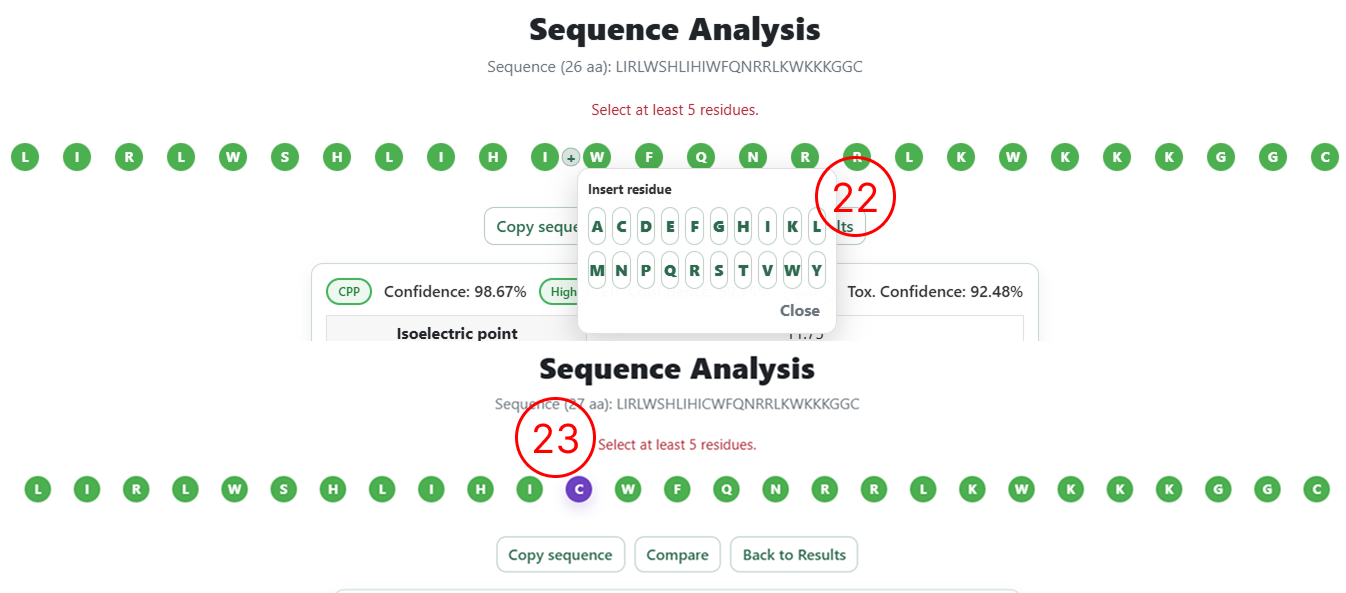
- Example of the editing menu that allows the user to modify the sequence with the following options: Delete, Insert left, Insert right, and Substitute.
- When the user selects Insert or Substitute, a list containing the 20 natural amino acids is displayed on the screen for selection.
Selecting sequences for re-analysis
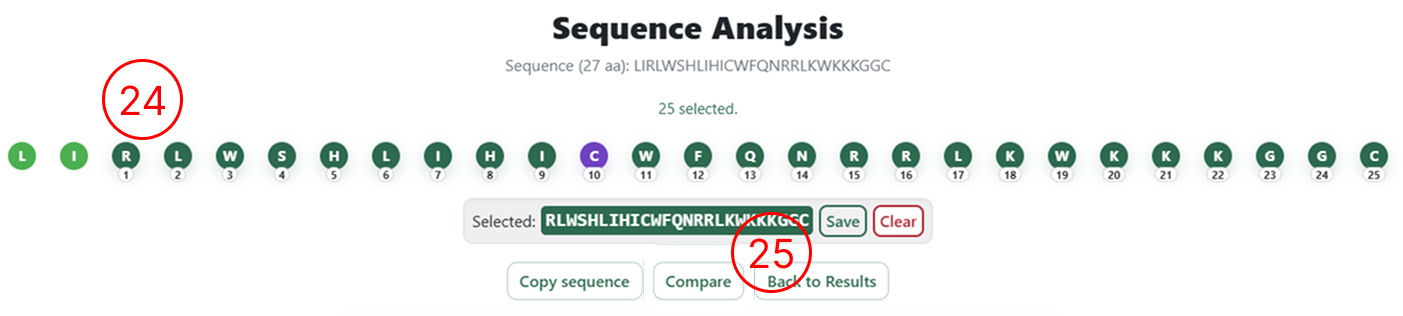
- After inserting, removing, or substituting amino acids, users can review the changes directly in the interface. Inserted residues are highlighted in purple, deleted residues in gray, and substituted residues in yellow.
- Once the editing is complete, click Compare to submit the modified sequence for prediction.
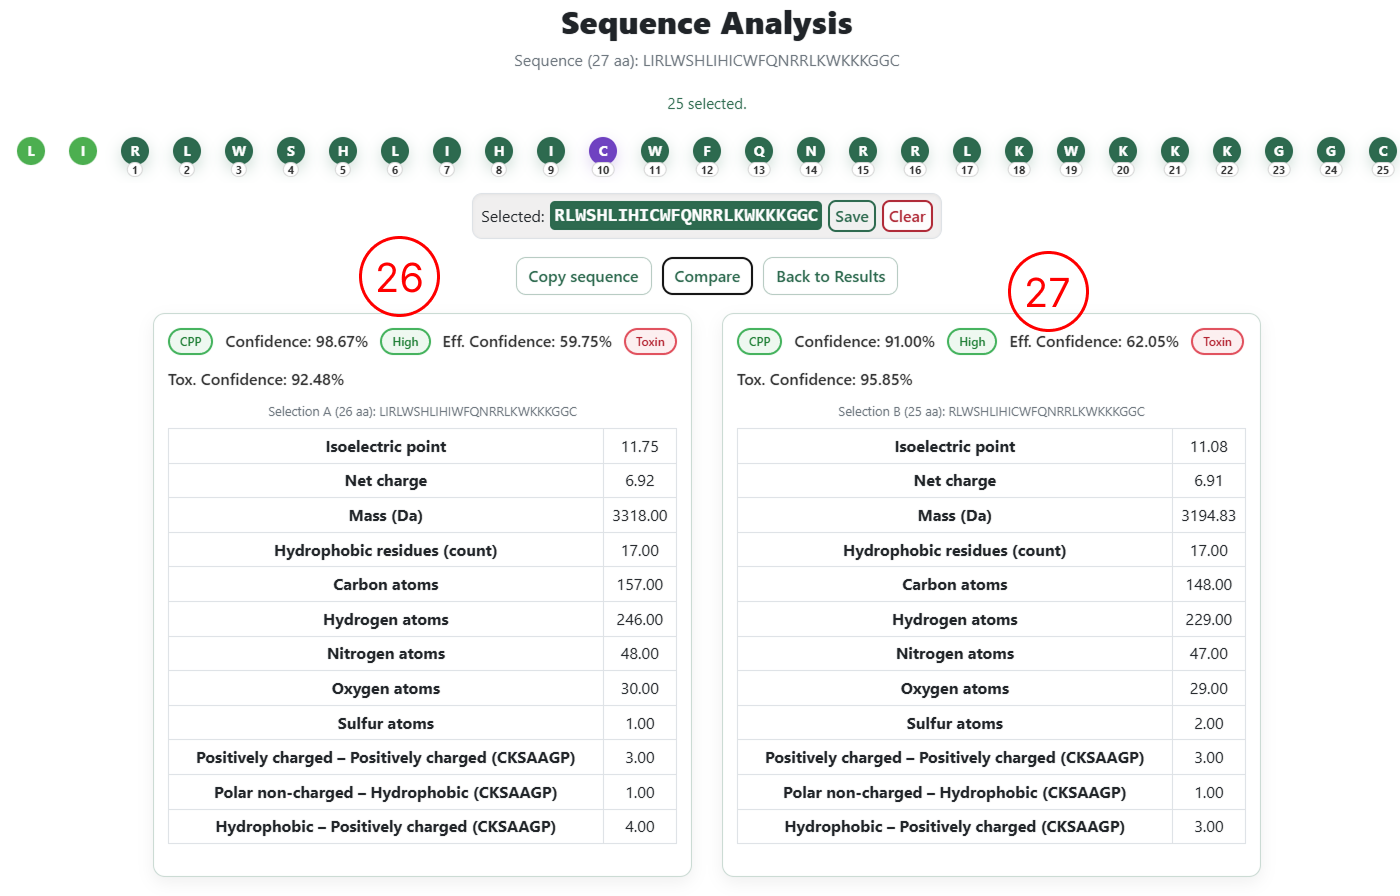
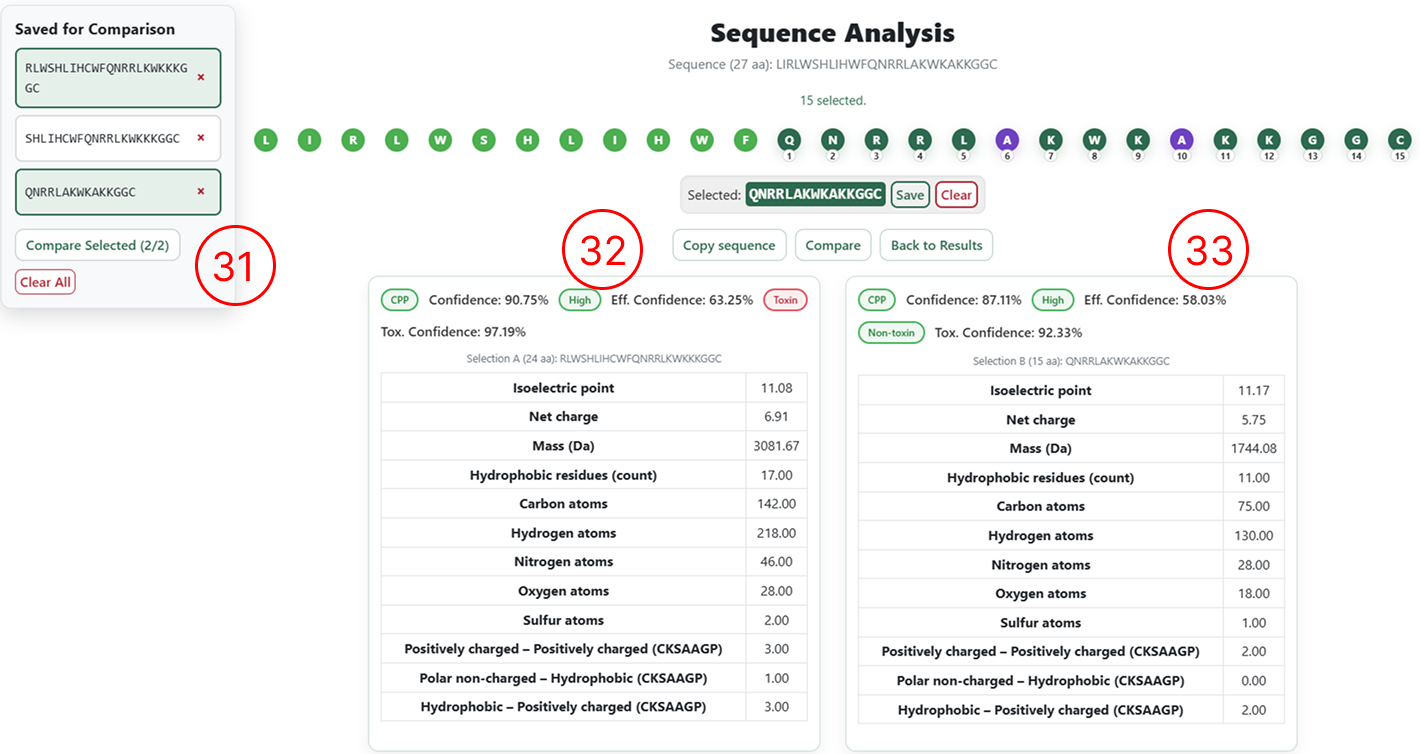
Side-by-side comparison
- Classification results and physicochemical descriptors for the original sequence.
- Classification results and physicochemical descriptors for the user-edited sequence.
Saving sequences for iterative design (optional)
This step is optional and is intended for users who wish to design multiple sequences simultaneously and perform iterative pairwise comparisons.
- For each generated sequence, clicking Save sequence adds the sequence to a table displayed on the left side of the interface.
- This table accumulates all sequences saved by the user during the session.
- As more sequences are generated and saved, they are progressively added to this list.
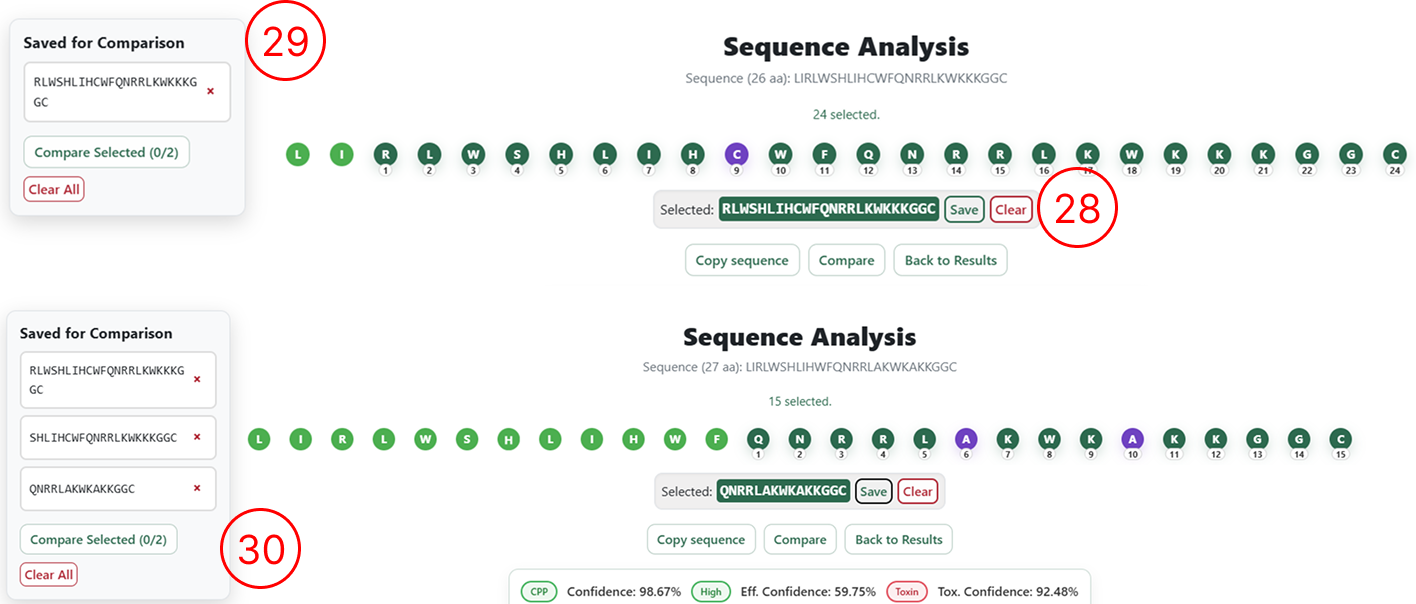
Comparing saved sequences
- To compare saved sequences, select the desired entries and click Compare Selected.
- Prediction results and classifications for the first selected sequence.
- Prediction results and classifications for the second selected sequence.
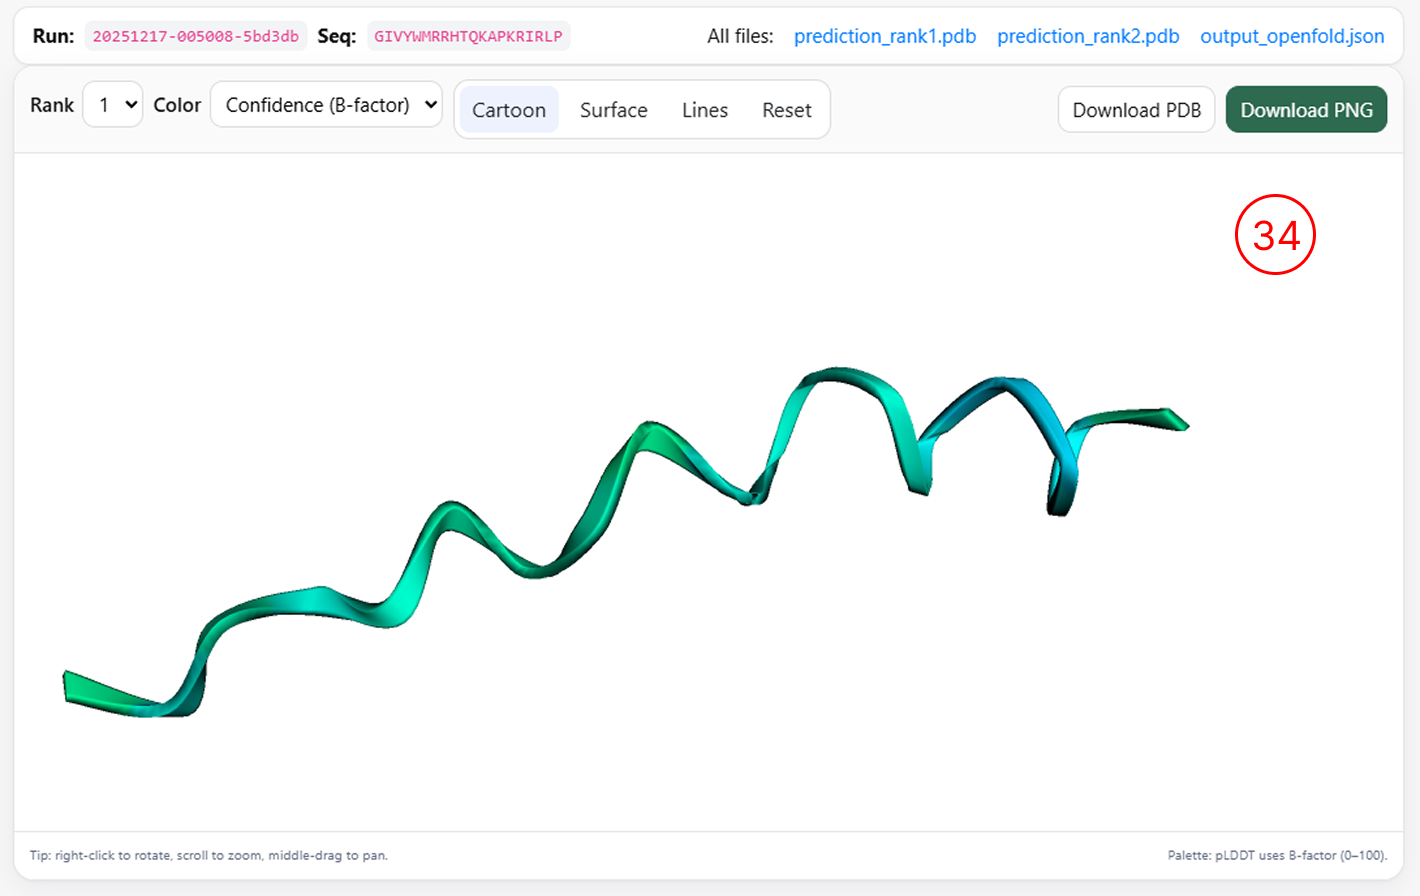
3D Structure
Three-dimensional structure visualization
- By clicking the 3D Structure icon (as shown in items 13 and 18), users can generate a three-dimensional representation of the selected peptide, provided that the sequence length is greater than 16 amino acids.
Browser compatibility
| OS | Version | Chrome | Firefox | Edge | Safari |
|---|---|---|---|---|---|
| Linux | Ubuntu 25.10 | 143.0.7499.146 | 146.0 | n/a | n/a |
| macOS | macOS Sequoia 15.7.2 | 143.0.7499.147 | 146.0 | n/a | 26.2 |
| Windows | Windows 11 | 143.0.7499.147 | 146.0 | 143.0.3650.80 | n/a |